S&P 500 in a classic ABC or expanded flat correction in wave IV In latest stock market signal
S&P 500 TECHNICAL ANALYSIS & PRICE FORECAST
2/16/20263 min read
My post content
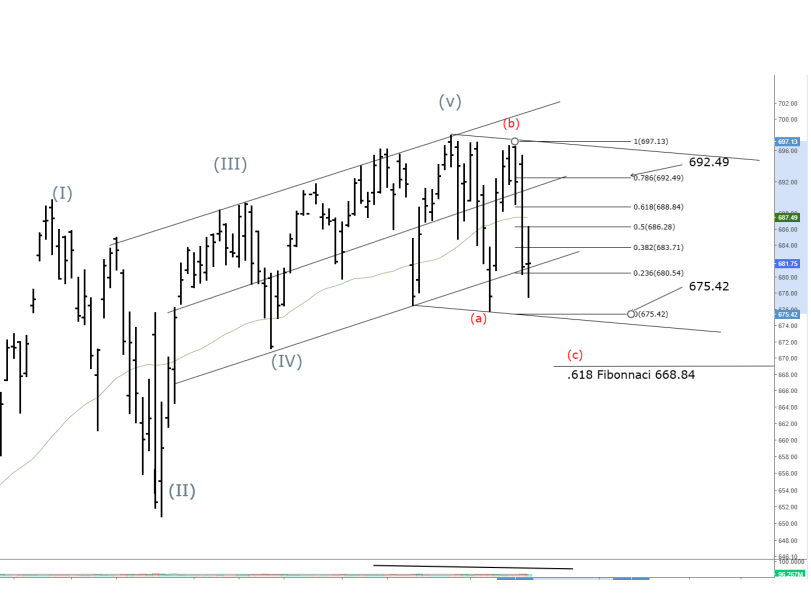
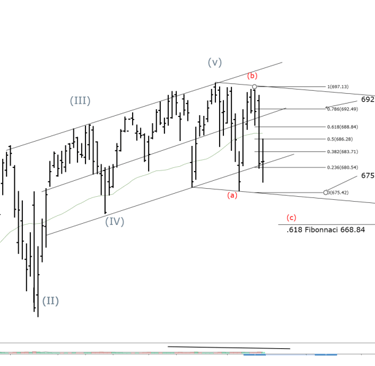
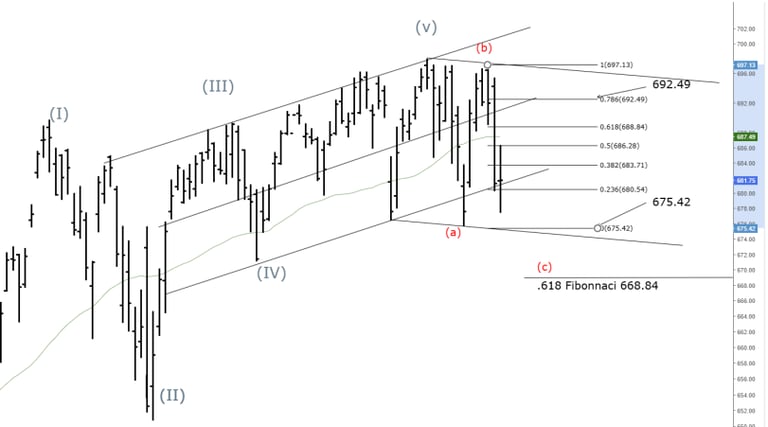
The current SPY structure is best understood as a corrective phase rather than the start of a new impulsive trend. Price action aligns closely with either a classic ABC correction or an expanded flat forming within wave IV, or possibly a higher-degree corrective wave. In both cases, the defining feature is that downside pressure remains corrective in nature, but unresolved. The most important technical reference in this framework is the 0.618 Fibonacci retracement zone between 668.68 and 668.84, which serves as the primary magnet for a potential wave (c) completion.
As of the February 13 close, SPY settled near 681.75 after trading a range that day between approximately 677.50 and 686.30. After-hours action remained weak, holding just under 681. This places price directly inside a fragile transition zone centered around 680 to 682, an area that coincides with the current zero-gamma flip. Below this zone, dealer positioning shifts decisively into negative gamma, which increases the probability of accelerated downside as hedging activity amplifies selling pressure rather than dampening it.
From a Fibonacci perspective, the structure below current price reveals a series of increasingly important downside shelves. The first meaningful support zone sits in the 675 to 674 region. This level aligns with the prior swing low labeled as wave (a) and coincides with a heavy concentration of put gamma. Historically, zones like this often produce at least an initial pause or reaction as dealers actively defend exposure. A controlled test of this level would be consistent with a normal corrective progression.
Below that, the market encounters an intermediate support cluster in the 671 to 669 region. This area often acts as a staging zone within corrections, where price either stabilizes briefly before resuming lower or produces a temporary bounce that ultimately fails. If selling pressure persists beyond this point, attention shifts to the 0.618 retracement near 668.7, which represents the most structurally significant downside target in the current setup. This level fits cleanly with wave (c) equality scenarios and tends to attract strong counter-trend responses, particularly if reached with expanding volume and momentum divergence.
Should volatility expand sharply or broader risk conditions deteriorate, a brief overshoot below the 0.618 level cannot be ruled out. In such a case, price could probe deeper retracement territory toward the mid-660s before meaningful stabilization occurs. While this scenario carries a lower probability, it remains a non-zero risk during periods of negative gamma and forced dealer hedging.
From a flow and positioning standpoint, gamma dynamics reinforce the Fibonacci framework. The region just below 680 represents a critical inflection where hedging behavior transitions from stabilizing to destabilizing. Beneath that level, downside moves tend to accelerate as dealers sell into weakness rather than absorbing it. By contrast, there is substantial put gamma support clustered near the mid-670s, which explains why that zone is likely to act as the first meaningful test of downside conviction. Below that, gamma thins materially, increasing the likelihood of a rapid move toward the 668 area if support fails.
On the upside, the market continues to face persistent resistance from overhead supply. Rallies into the mid-680s remain vulnerable, particularly in the 683 to 688 region where prior breakdowns occurred and gamma support is thin. Any attempt to push higher without a decisive shift in volume and positioning risks becoming another lower high within the broader corrective structure. A more formidable resistance zone sits near 692, where sellers have repeatedly asserted control.
Looking ahead to the coming sessions, the most probable path involves continued choppy price action followed by a renewed push lower. A modest rally into overhead resistance followed by rejection would fit cleanly within the corrective narrative and open the door for a test of the 675 region. If momentum builds and gamma pressure intensifies, continuation toward the 668 retracement becomes increasingly likely. Alternative outcomes remain possible, including a faster breakdown early in the week or a brief upside surprise driven by short covering, but neither scenario alters the broader conclusion unless key resistance levels are reclaimed and held.
In summary, SPY remains in a corrective environment where downside targets are well defined and upside progress remains constrained. Until price can reclaim and sustain trade above the upper resistance zones, rallies should be treated as counter-trend moves within a larger corrective phase. The resolution of this structure is likely to occur near the deeper Fibonacci supports, where the market will reveal whether the correction has fully run its course or whether further downside is required to restore balance.